Tag Archives: Fortinet

New bandwidth column added to realtime FortiView pages

New bandwidth column added to realtime FortiView pages

The FortiView console provides a new bandwidth column that displays information for bandwidth calculated on a per-session level, providing administrators the ability to sort realtime bandwidth usage in descending order.

Visualization support for the Admin Logins page

Visualization support for the Admin Logins page

A useful chart is now generated for Admin login events under FortiView > Admin Logins. You can view the information in either Table View or Timeline View (shown below). In Timeline View, each line represents on administrator, with individual sessions indicated per administrator line. When you hover over a particular timeline, detailed information appears in a tool tip.

cool new chart

Links created between FortiView and View/Create Policy

Links created between FortiView and View/Create Policy

The Policy column in FortiView consoles and the Log Viewer pages has changed to a link, which navigates to the

IPv4 or IPv6 policy list and highlights the policy.

Right-clicking on a row in FortiView or the Log Viewer has menu items for Block Source, Block Destination and Quarantine Source where appropriate columns are available to determine these values. When multiple rows are selected, the user will be prompted to create a named Address Group to contain the new addresses.

When the user clicks Block Source or Block Destination they are taken to a policy creation page with enough information filled in to create a policy blocking the requested IP traffic.

The policy page will feature an informational message block at the top describing the actions that will be taken. Once the user submits the form, the requisite addresses, groups and policy will be created at once.

If the user clicks on Quarantine User then they will be prompted for a duration. They may also check a box for a

Permanent Ban. The user can manage quarantined users under Monitor > User Quarantine Monitor.

Realtime visualization

Realtime visualization

In addition to these new visualization options, you can now also enable realtime visualization.

To enable realtime visualization

1. Click on the Settings icon next to the upper right-hand corner and select Auto update realtime visualizations.

An option is displayed to set the Interval (seconds). The maximum value is 300.

2. Enter a desired Interval and click Apply.


New Consoles

New Consoles

In FortiOS 5.4, a variety of new consoles have been added to FortiView:

FortiView Policies console

The new Policies console works similarly to other FortiView consoles, yet allows administrators to monitor policy activity, and thereby decide which policies are most and least active. This helps the administer to discern which policies are unused and can be deleted.

In addition, you have the ability to click on any policy in the table to drill down to the Policies list and view or edit that policy. You can view this new console in either Table or Bubble Chart view.

FortiView Interfaces console

The new Interfaces console works similarly to other FortiView consoles and allows administrators to perform current and historical monitoring per interface, with the ability to monitor bandwidth in particular. You can view this new console in either Table or Bubble Chart view.

FortiView Countries console

A new Countries console has been introduced to allow administrators to filter traffic according to source and destination countries. This console includes the option to view the Country Map visualization (see below).

FortiView Device Topology console

The new Device Topology console provides an overview of your network structure in the form of a Network

Segmentation Tree diagram (see below).

FortiView Traffic Shaping console

A new Traffic Shaping console has been introduced to improve monitoring of existing Traffic Shapers. Information displayed includes Shaper info, Sessions, Bandwidth, Dropped Bytes, and more.

FortiView Threat Map console

A new Threat Map console has been introduced to monitor risks coming from various international locations arriving at a specific location, depicted by the location of a FortiGate on the map (see below).

FortiView Failed Authentication console

A Failed Authentication console has been added under FortiView that allows you to drill down an entry to view the logs. This new console is particularly useful in determining whether or not the FortiGate is under a brute force attack. If an administrator sees multiple failed login attempts from the same IP, they could (for example) add a local-in policy to block that IP.

The console provides a list of unauthorized connection events in the log, including the following:

  • unauthorized access to an admin interface (telnet, ssh, http, https, etc.) l  failure to query for SNMP (v3) or outside of authorized range (v1, v2, v3) l  failed attempts to establish any of the following:
  • Dial-up IPsec VPN connections
  • Site-to-site IPsec VPN connections
  • SSL VPN connections
  • FGFM tunnel

FortiView WiFi Clients console

The WiFi Clients console has been added to FortiView in FortiOS 5.4. As you might expect, you can use this console to display top wireless user network usage and information. You can drilldown to filter the information that is displayed.

Information displayed includes Device, Source IP, Source SSID, AP, and more.

GUI favorites and search (307478)

GUI favorites and search (307478)

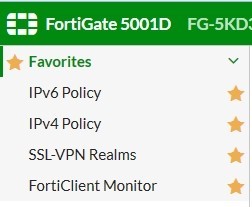
If there is a GUI page that you use often, rather than having to click through the GUI menu to find it you can select the star icon to make it a favorite page. Making something a favorite adds a new Favorites menu, which, when you open it, lists your favorite GUI pages. Making a page a favorite doesn’t remove it from its location in the GUI menu.

FortiOS 54 Favorites


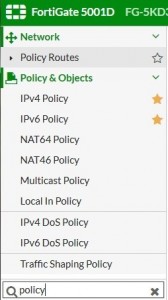
A search field has been added to the bottom of the GUI menu allowing you to search GUI page names for keywords. GUI page names that match the keyword appear and you can select the one you are looking for.

FortiOS 54 Favorites 2

Most diagnose sys dashboard commands removed (129248)

The diagnose sys dashboard reset command is still available.


Other GUI changes(129248)

Other GUI changes(129248)

You can no longer add custom dashboard tabs. The following CLI command has been remvoed:

config system admin edit <admin>

config dashboard-tabs end

Lite version of the GUI (available on some low level models) has been removed including the following CLI

command:

config system settings

set gui-lite (disable | enable}

end

You can no longer configure multiple custom dashboard widgets. The following CLI command has been removed:

config system admin edit <admin>

config dashboard edit 0

set widget-type app-usage set widget-type storage

set widget-type protocol-usage

set widget-type device-os-dist “Device/

next

HTTP obfuscating has also been removed, including the following CLI command.

config system global set http-obfuscate

end

Display the hostname on the GUI login page (129248)

Display the hostname on the GUI login page (129248)

You can use the following CLI command to display the hostname on the GUI login page

config system global

set gui-display-hostname {disable | enable}

end