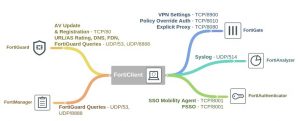
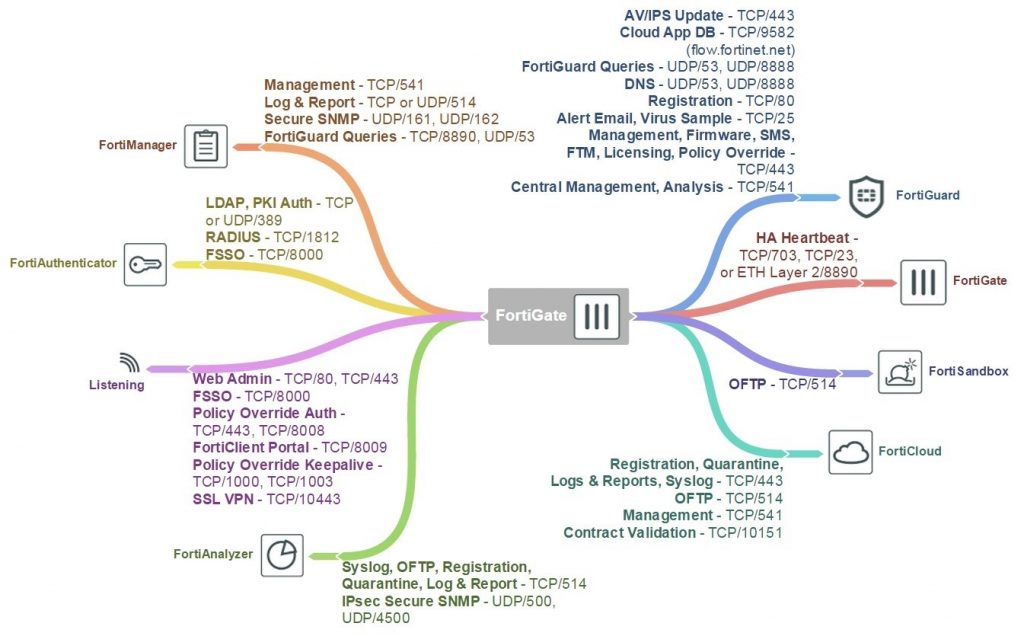
FortiClient Open Ports Diagram
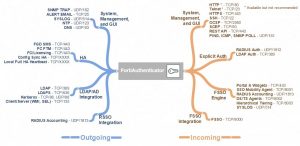
FortiAuthenticator Open Ports Diagram
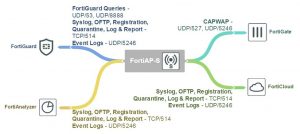
FortiAP-S Open Ports Diagram
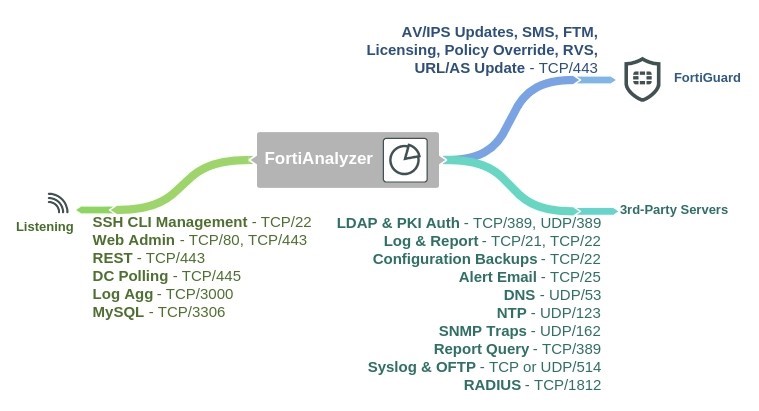
FortiAnalyzer Open Ports Diagram
FortiGate Open Ports Diagram
WCCP Diagnose commands
Diagnose commands
The following get and diagnose commands are available for troubleshooting WAN optimization, web cache, explicit proxy and WCCP.
get test {wad | wccpd} <test_level>
Display usage information about WAN optimization, explicit proxy, web cache, and WCCP applications. Use <test_level> to display different information.
get test wad <test_level>
get test wccpd <test_level>
Variable Description
wad Display information about WAN optimization, web caching, the explicit web proxy, and the explicit FTP proxy.
wccpd Display information about the WCCP application.
Examples
Enter the following command to display WAN optimization tunnel protocol statistics. The http tunnel and tcp tunnel parts of the command output below shows that WAN optimization has been processing HTTP and TCP packets.
get test wad 1
WAD manager process status: pid=113 n_workers=1 ndebug_workers=0
Enter the following command to display all test options:
get test wad
WAD process 82 test usage:
1: display process status
2: display total memory usage.
99: restart all WAD processes
1000: List all WAD processes.
1001: dispaly debug level name and values
1002: dispaly status of WANOpt storages
1068: Enable debug for all WAD workers.
1069: Disable debug for all WAD workers.
2yxx: Set No. xx process of type y as diagnosis process.
3: display all fix-sized advanced memory stats
4: display all fix-sized advanced memory stats in details
500000..599999: cmem bucket stats (599999 for usage)
800..899: mem_diag commands (800 for help & usage)
800000..899999: mem_diag commands with 1 arg (800 for help & usage)
80000000..89999999: mem_diag commands with 2 args (800 for help & usage)
60: show debug stats.
61: discard all wad debug info that is currently pending
62xxx: set xxxM maximum ouput buffer size for WAD debug. 0, set back to default.
68: Enable process debug
69: Disable process debug
98: gracefully stopping WAD process
9xx: Set xx workers(0: default based on user configuration.)
Troubleshooting WCCP
Troubleshooting WCCP
Two types of debug commands are available for debugging or troubleshooting a WCCP connection between a FortiGate unit operating as a WCCP router and its WCCP cache engines.
Real time debugging
The following commands can capture live WCCP messages:
diag debug en
diag debug application wccpd <debug level>
Application debugging
The following commands display information about WCCP operations:
get test wccpd <integer>
diag test application wccpd <integer>
Where <integer> is a value between 1 and 6:
1. Display WCCP stats
2. Display WCCP config
3. Display WCCP cache servers
4. Display WCCP services
5. Display WCCP assignment
6. Display WCCP cache status
Enter the following command to view debugging output:
diag test application wccpd 3
Sample output from a successful WCCP connection:
service-0 in vdom-root: num=1, usable=1 cache server ID:
len=44, addr=172.16.78.8, weight=4135, status=0 rcv_id=6547, usable=1, fm=1, nq=0, dev=3(k3), to=192.168.11.55
ch_no=0, num_router=1:
192.168.11.55
Sample output from the same command from an unsuccessful WCCP connection (because of a service group password mismatch):
service-0 in vdom-root: num=0, usable=0 diag debug application wccpd -1
Sample output:
wccp_on_recv()-98: vdom-root recv: num=160, dev=3(3),
172.16.78.8->192.168.11.55
wccp2_receive_pkt()-1124: len=160, type=10, ver=0200, length=152
wccp2_receive_pkt()-1150: found component:t=0, len=20 wccp2_receive_pkt()-1150: found component:t=1, len=24 wccp2_receive_pkt()-1150: found component:t=3, len=44 wccp2_receive_pkt()-1150: found component:t=5, len=20 wccp2_receive_pkt()-1150: found component:t=8, len=24 wccp2_check_security_info()-326: MD5 check failed

